The results
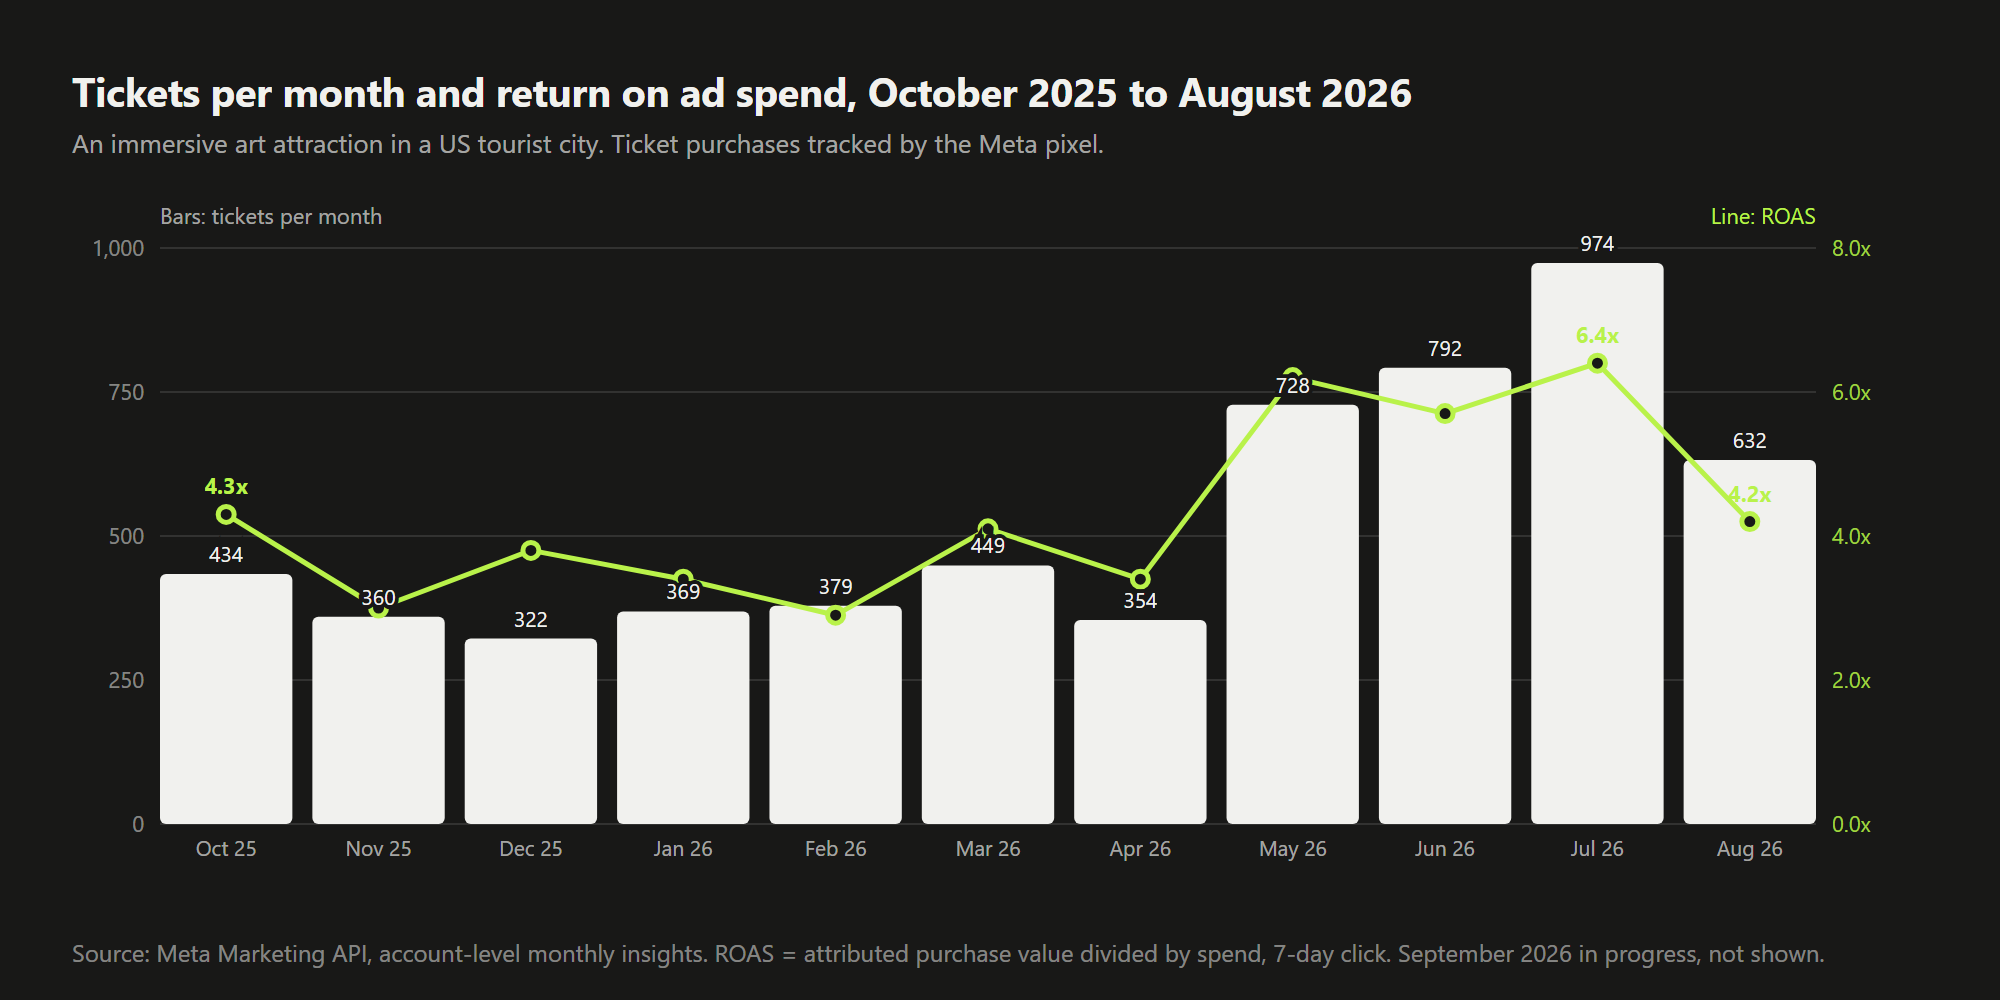
- 6.4xReturn on ad spend in July 2026, up from 3.4x in January. Every dollar in Meta returned $6.45 in ticket revenue that month.
- 2.6xMonthly tickets went from 369 in January to 974 in July, on a budget that grew 50%, not 160%.
- $356kAttributed ticket revenue from January to August 2026, on $76,000 of ad spend. 4,677 tickets, a blended 4.7x.
The context
Attractions sell to two audiences that behave nothing alike: locals, who come back for events and bring friends, and tourists, who decide in the city with a phone in hand. This account had years of history, a loyal following and a brand voice the client protects closely. What it did not have was a creative rhythm. The same evergreen videos had been running since the previous summer.
When I joined in October 2025 the account returned about 3.6x with 300 to 430 tickets a month. Good, and flat.
What I did
Stage 1: keep the structure, add a straight line to the calendar
October 2025 to February 2026
- Kept the evergreen structure the account had earned: a locals campaign, a surrounding-markets campaign and a tourist campaign, each CBO on the purchase event, with 180-day purchaser exclusions so the ads chase new buyers.
- Added a ticket-page campaign in January that sends every click straight to the timed-entry calendar instead of the home page. It became the second biggest spender in the account.
- Ran the seasonal pushes (holidays, festival weekends, local events) as short campaigns with their own end dates, so they never bleed into the evergreen budget.
Stage 2: a creative batch a month, each with its own budget
March to August 2026
- Monthly creative batches from the client's content team, rewritten in the brand's voice and reviewed by the client as preview links before launch. Every batch goes live in its own campaign with a fixed budget, so the new work is measured against the evergreen in the same week.
- The May batch changed the account. Tickets went from 354 in April to 728 in May and 974 in July; return on ad spend from 3.4x to 6.4x. The budget went up 50% over the same months because the batch earned it.
- Scaled inside the numbers: budget increases were tied to the previous week's return, never to the calendar.
What did not work
- February. Carnival season pushes pulled the average down to 2.9x: the seasonal campaigns sold, but at a higher cost per ticket than the evergreen. Seasonal budgets now start small and scale on proof.
- August. Tickets dropped from 974 to 632 as the May batch aged into its fourth month and the summer tourist season ended. The next batch is the answer, and it should have gone live in July.
- Merchandise. A merch campaign ran most of the year at a small fixed budget without ever matching the ticket campaigns' return. It stays for the client's reasons, not for the numbers.
What this looks like for an agency partner
This account gets a monthly batch of ads written in the client's voice and sent for approval as preview links, a seasonal calendar with end dates set in advance, and a report with tickets, cost per ticket and return on ad spend. The agency owns the relationship. I own the account.
$350 per account, per month, fixed. No minimums.