The results
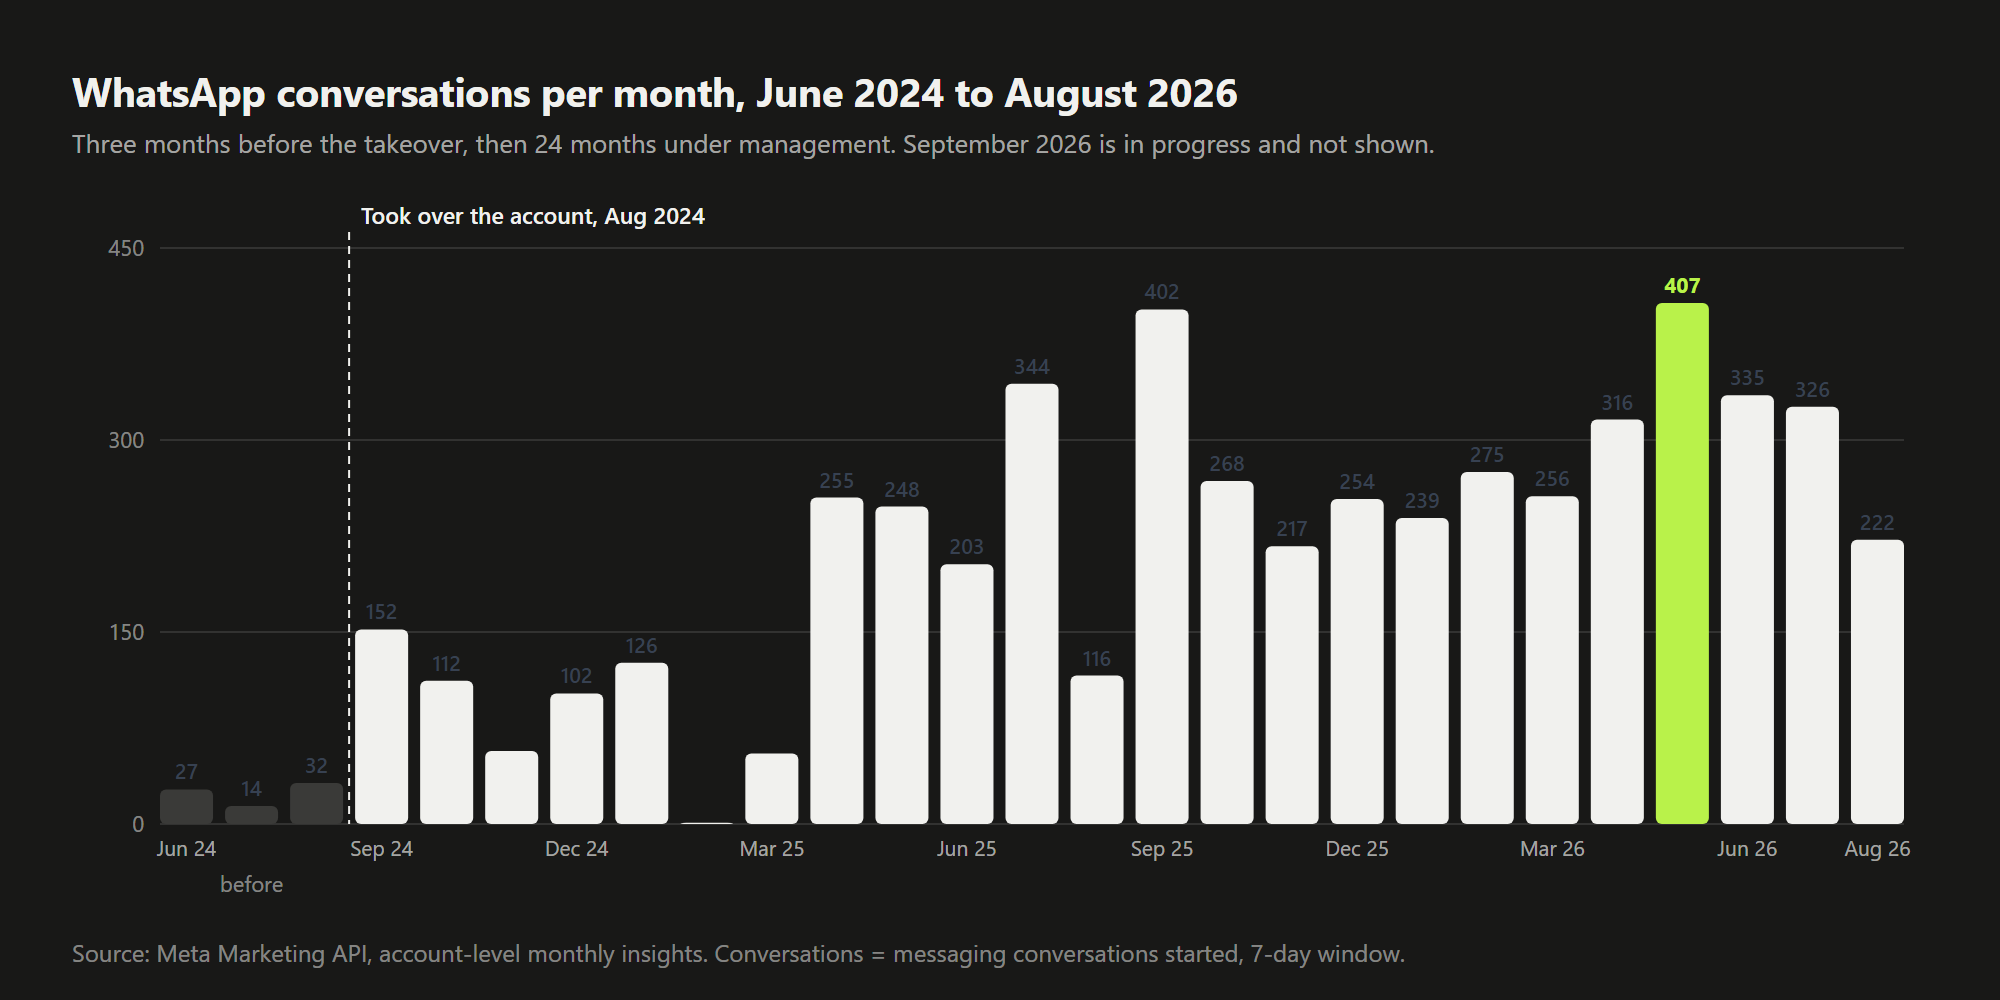
- 12xMonthly WhatsApp conversations went from 24 on average in the three months before I took over to 297 on average in 2026.
- 4xConversations per 1,000 impressions went from 0.6 to 2.3. The account got four times better at turning attention into a sales conversation, independent of currency or inflation.
- 4.7xFirst full month on the account: conversations went from 32 to 152 on 3.3x the budget. Cost per conversation dropped 30% in the same month.
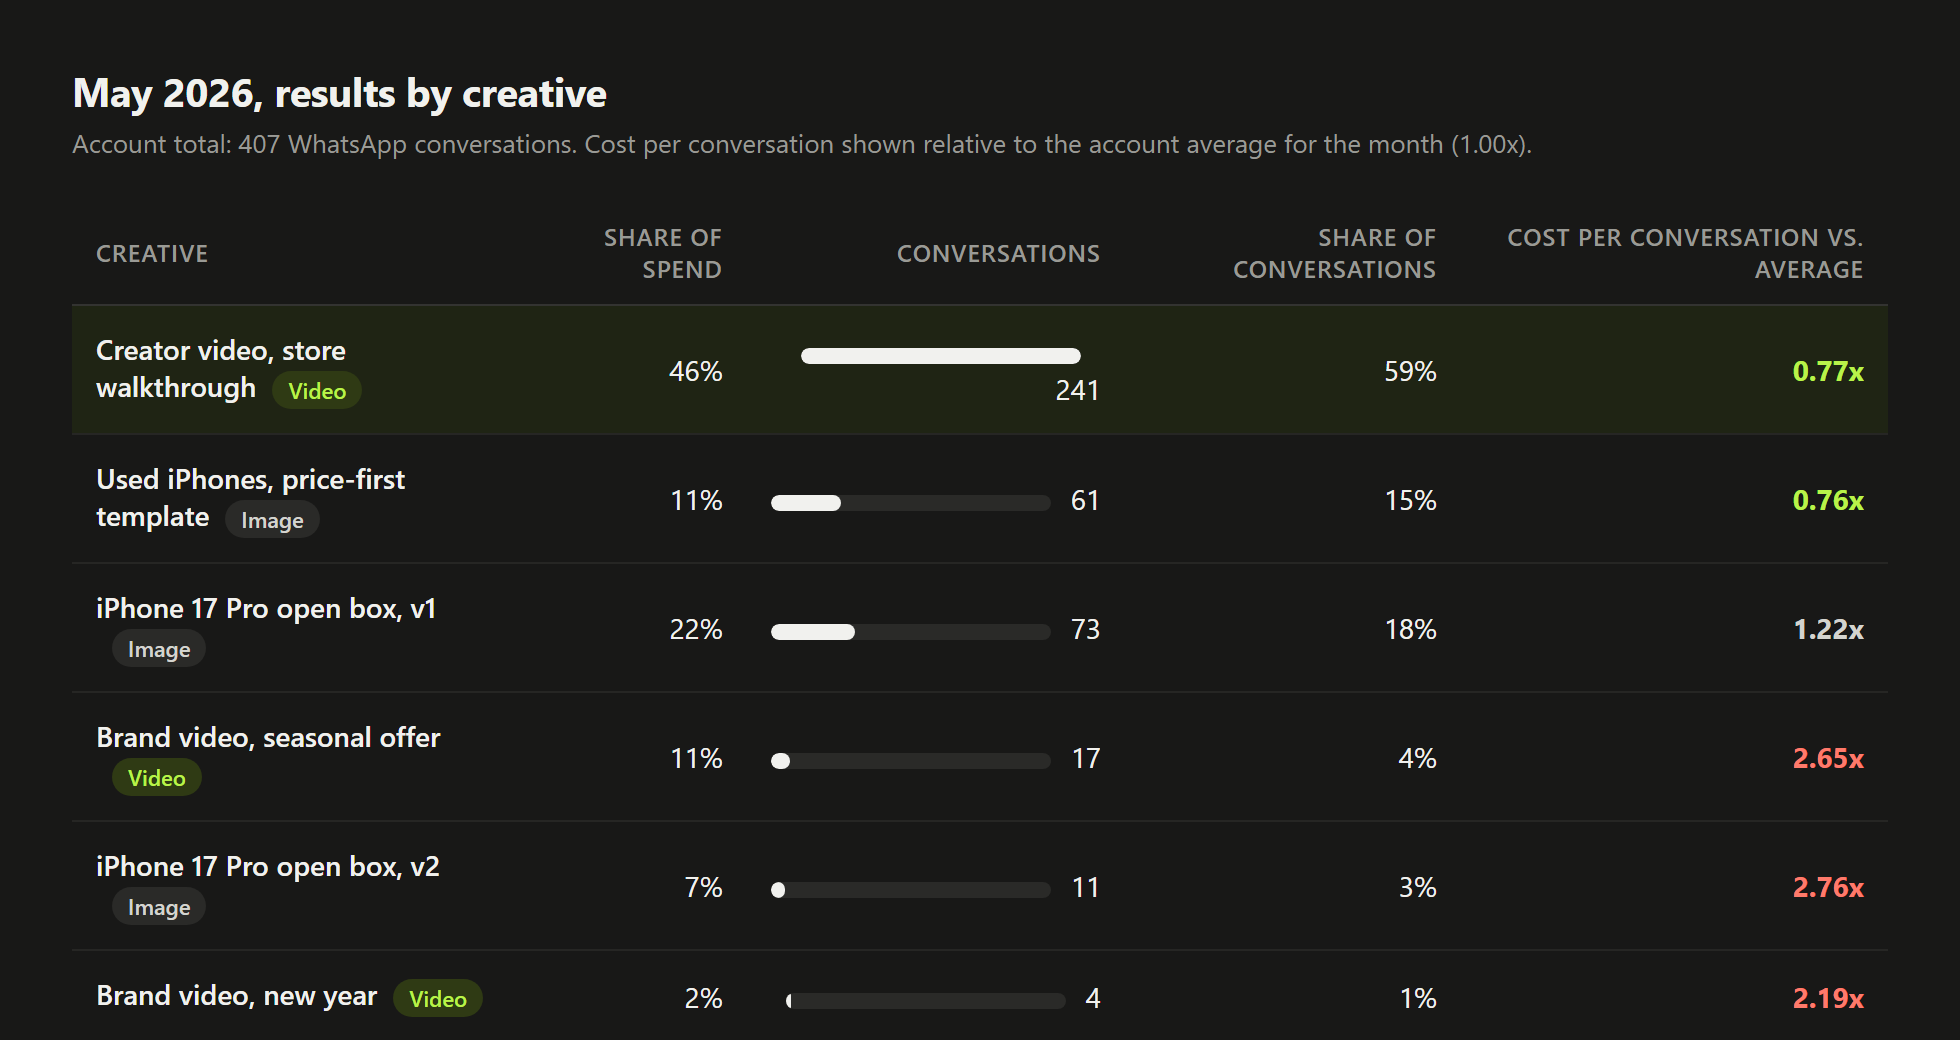
- 407Best month on record, May 2026. One creator video delivered 59% of it at 23% below the account's average cost.
The context
Tecnocel sells iPhones, MacBooks and gaming gear in a market where nobody buys a phone without asking a question first. Price, condition, payment plans, delivery. So the campaigns do not optimize for purchases or leads. They optimize for a started WhatsApp conversation, and the store closes the sale by chat.
When I took over in August 2024 the account was spending a small budget on boosted Instagram posts and a single cold-traffic campaign, getting between 14 and 32 conversations a month. The business wanted volume. The constraint was a small budget in a currency that loses value every month, which makes "cost per result" a moving target and forces you to judge efficiency by ratios, not by pesos.
What I did
Stage 1: funnel and structure
August 2024 to early 2025
- Built the account as a funnel of three campaigns: cold prospecting, warm engagement audiences, and remarketing to people who had already messaged or engaged.
- Moved every campaign to the messaging objective with WhatsApp as the destination. No Messenger, no website.
- Geo-targeted a 4-mile radius around the store instead of the whole metro area. Most customers pick up in person.
- Set a naming convention with creation date and hook in every ad name, so performance by creative and by launch date could be read at a glance.
Result: 152 conversations in September 2024, the first full month, against 32 in August. The account closed 2025 with 2,489 conversations, 207 a month on average, 8.6x the pre-takeover rate.
Stage 2: consolidation and audience testing
Early 2026
- Collapsed the three campaigns into one, with the funnel stages as ad sets. Less fragmentation, faster learning at the same budget.
- Tested an audience built from 365 days of Instagram engagement against a cold interest-based audience. The warm pool won on cost per conversation for three consecutive months, 5% to 23% cheaper. Budget followed the winner.
- Introduced a monthly performance report to the client with the same four numbers every month: spend, conversations, cost per conversation, and frequency. Plus what worked, what did not, and what changes next month.
Stage 3: creative is the lever
April to May 2026
By April the account was saturated. Frequency hit 3.9x and reach had shrunk by half. More budget was buying the same people again.
- Launched a video with a local creator showing the store, the phones and the buying process. It was the first ad with a real person on camera instead of product photos.
- The video delivered 241 of the 407 conversations in May, 59% of the month, at a cost 23% below the account average. In June it did it again: 177 conversations, 53% of the month, at 43% below average.
- Reach recovered 38% and frequency dropped below 3x while conversations set a record. More volume and cheaper at the same time.
- A second finding: it was not "video" that worked. Two brand videos running the same month cost 2.2x and 2.6x the average. It was specifically the creator format.
Stage 4: reading a bad month correctly
August 2026
August closed with 222 conversations at the highest cost per conversation in 13 months. The easy read was "the creative fatigued". The data said something else.
- Impressions dropped 43% on the same budget: CPM rose 76%. Inventory got expensive, not the message. Conversions per impression actually improved 20%.
- Three product images took 46% of the budget at 2x the cost of everything else.
- The creator video, after four months on air, had doubled its original cost per conversation. Still the volume leader, no longer the efficiency leader.
What changed in September: the three expensive images were paused, the freed budget moved to a new broad ad set (geo and age only) that had just beaten both existing audiences on CPM, and a new batch of creator videos was briefed. First 13 days of September: 151 conversations at a cost 38% below August.
What did not work
- A MacBook Air launch image took 29% of June's budget at 3.5x the account's average cost. One weak product line dragged the whole month's average up. Lesson: cap any single creative at a share of budget until it proves itself.
- Three near-duplicate iPhone open-box images ran side by side for two months, splitting budget and learning. Consolidated into one.
- The account still lacks the number that matters most: how many conversations turn into sales. Cost per conversation is a proxy. A lightweight CRM is on the client's roadmap, and until then every optimization is on the proxy.
What this looks like for an agency partner
This account runs on 6 to 8 hours a month: weekly optimization, one creative refresh cycle, and one report. The client gets a media buyer who reads CPM before blaming the creative and who tells them when a month was bad and why. The agency gets the same report with their logo on it.
$350 per account, per month, fixed. No minimums.